Menu analysis: the five numbers to track every month
A monthly menu analysis routine: sales mix, contribution margin, popularity index, attachment rate and item count, with the thresholds that trigger a change.
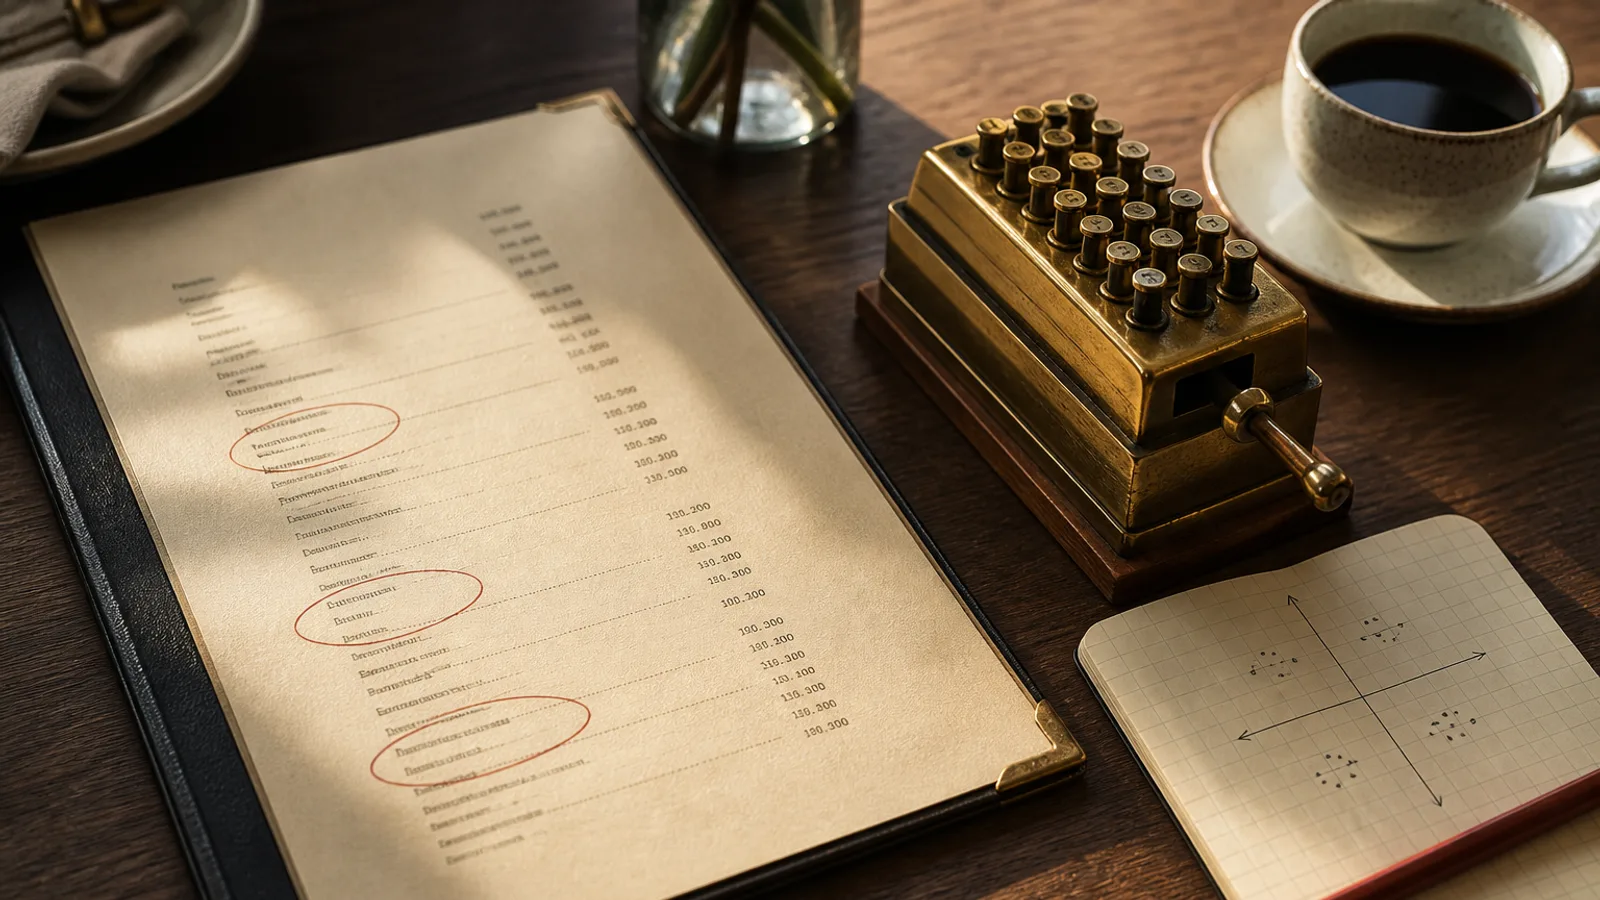
Most till systems can export a report that lists every dish sold last month with its quantity and revenue. Very few restaurant owners open it, and of those who do, most look at the top ten and close it again. That report, combined with your recipe costs, contains everything you need to decide what stays on the menu, what moves, what gets repriced and what goes. Here are the five numbers to pull from it, how to calculate each in a spreadsheet, and the threshold at which each one should make you change the printed menu.
1. Sales mix: the share of each dish within its section
Sales mix is the percentage of a section's units that each dish represents. If your mains sold 1,200 plates last month and the sea bass sold 180, its mix is 15 %. Calculate it within the section, not across the whole menu, because a starter and a main are never competing for the same choice.
The benchmark is the even share: with 8 mains, each would sell 12.5 % if guests chose at random. The classic menu engineering convention, going back to the Kasavana and Smith model that Cornell popularised, treats a dish as popular if it sells at least 70 % of that even share, so 8.75 % in an 8-dish section. Anything below that for two consecutive months is a candidate for removal or repositioning.
2. Contribution margin: euros per plate, not percentage
Contribution margin is the selling price minus the portion food cost, in euros. A 24 € sea bass with a 9 € cost carries 15 €; a 14 € pasta with a 3 € cost carries 11 €. The pasta has a far better food cost percentage, 21 % against 37 %, but the sea bass puts 4 € more in the till every time it is ordered.
Calculate the average contribution margin of each section, weighted by units sold. Dishes above the average are your high-margin items; dishes below are low. Cross this with the popularity threshold from the sales mix and every dish falls into one of the four classic boxes: stars (popular and profitable), plowhorses (popular, low margin), puzzles (unpopular, high margin) and dogs (neither). The menu decision follows from the box.
- Stars: protect. Do not change the recipe, do not move them, and give them the best positions on the page.
- Plowhorses: fix the cost. Reduce the portion slightly, substitute one expensive component, or raise the price by 0.50 to 1 €.
- Puzzles: fix the presentation. Better position, longer description, a pairing line. Give them one more season before dropping them.
- Dogs: remove, unless a dish exists for a reason the numbers cannot see, such as the only vegan main.
3. Total contribution per dish over the month
Multiply units sold by contribution margin and you get the euros each dish actually brought in. This is the column to sort by. It often surprises: a dish nobody in the kitchen talks about turns out to be the second-biggest earner because it sells steadily at a healthy margin, while the signature dish that everyone photographs contributes less than the side of fries.
Use it to find the 80/20 line. In most independent restaurants, around 20 % of dishes generate 70 to 80 % of gross margin. The other 80 % of the menu exists to make the 20 % look like a choice. That is fine, but it means the long tail should be cheap to prep and easy to keep in stock, and it should be shorter than most owners let it become.
4. Attachment rate: what gets added to the main
Attachment rate is the share of mains sold with a side, a starter, a dessert or a drink. Calculate each separately: sides per main, desserts per cover, glasses of wine per cover. These numbers respond quickly to design changes, which makes them the best way to test whether moving the sides block or adding a pairing line did anything.
Typical values in a bistro are 0.3 to 0.5 sides per main and 0.35 to 0.5 desserts per cover; a dessert rate below 0.3 usually means the dessert list is on the same page as the mains and is being read too early. Wine by the glass per cover varies widely by venue type, but a drop month on month with unchanged prices is a signal that the list or its layout has stopped working.
5. Item count and the length of the printed page
The fifth number is the simplest: how many dishes are on the menu, per section and in total. Track it because it only ever grows unless someone watches it. A menu that gains two dishes a quarter without losing any doubles in three years, and every added line costs reading time, prep, stock and space on the page.
Set a ceiling and defend it. For a bistro, 5 to 7 starters, 6 to 8 mains and 4 to 5 desserts on a single A4 or A5 bifold is a comfortable maximum at a readable 10 to 11 pt. Each time a dish comes in, one goes out, and the numbers above tell you which.
The monthly routine, in forty minutes
On the first working day of the month, export last month's item sales from the till to a spreadsheet. Paste in your portion costs from the recipe cards. Add columns for mix, margin, total contribution and the four-box classification. Look at the three dogs with the lowest total contribution and the three plowhorses with the highest units, and decide one action for each. Then check attachment rates against the previous month.
If two months in a row point to the same change, make it and reprint. That reprint is the step where most analysis dies, because the menu file is with a designer or in software nobody on the team opens. In Menu Atelier the dishes and prices are data you edit directly; removing a dog, repricing a plowhorse and moving a puzzle to the top of its section takes a few minutes, the layout regenerates, and the print-ready PDF is ready for the next service, so the analysis can actually change the page each month.